eCommerce KPI Dashboard
- Flows
- Entity Relationship Diagram
- Table Description
- Data Sources
- Data Destinations
- How to Use Template
- How to Use Data App
- Authorizing Data Sources
- Authorizing Data Destinations
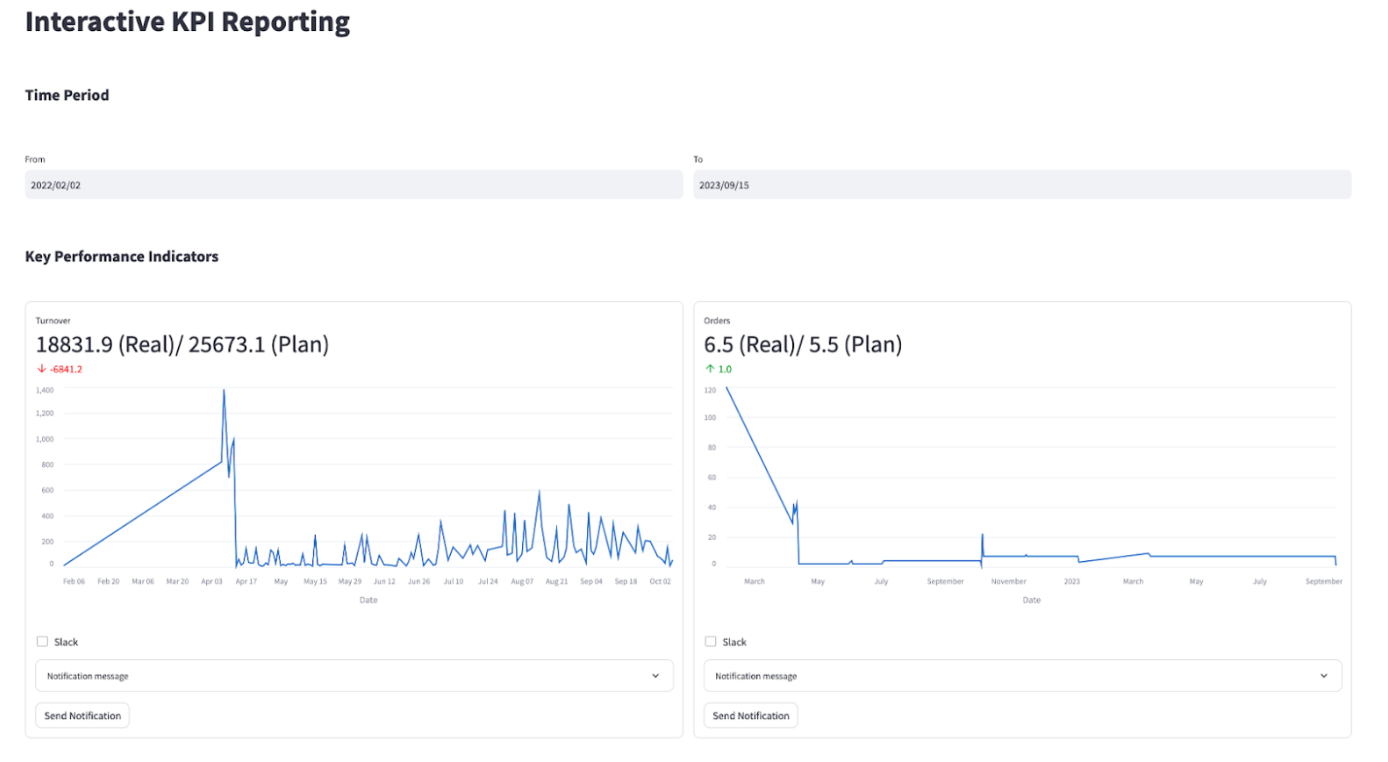
Utilizing eCommerce KPI dashboards powered by Shopify data provides a comprehensive overview of critical financial metrics, including turnover, orders, and customer data. These insights are presented through a pre-defined data app dashboard equipped with a date filter for your convenience.
The dashboards display a comparison between planned numbers and the actual situation. Moreover, the data app facilitates effortless parameter sharing, enabling seamless integration with Slack for quick communication.
With all your data centralized in a single table and location, the need for manual data collection across multiple systems is eliminated, thanks to the automated capabilities of Keboola. Simplify your data management with ease.
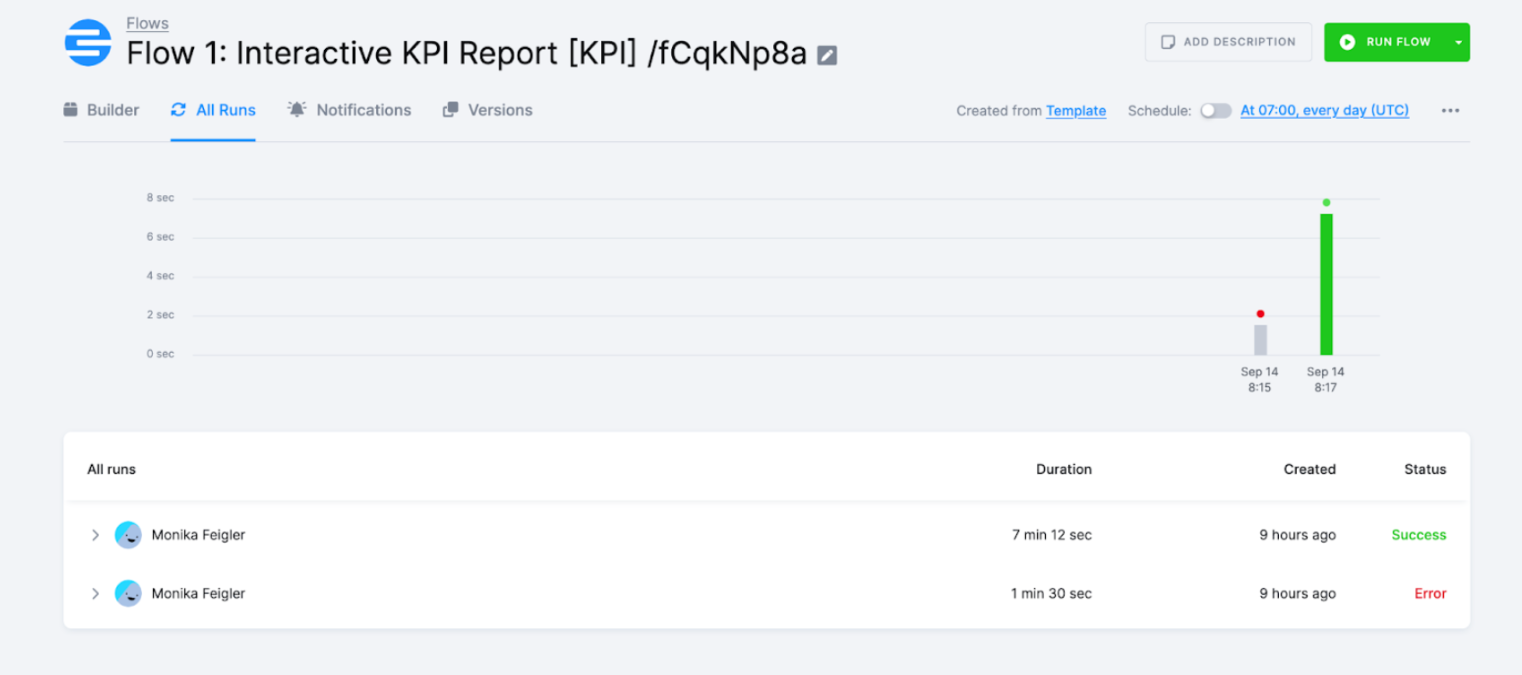
Flows
The template consists of two separate flows, one for building interactive dashboards and the other for sending data into Slack.
Building Dashboards
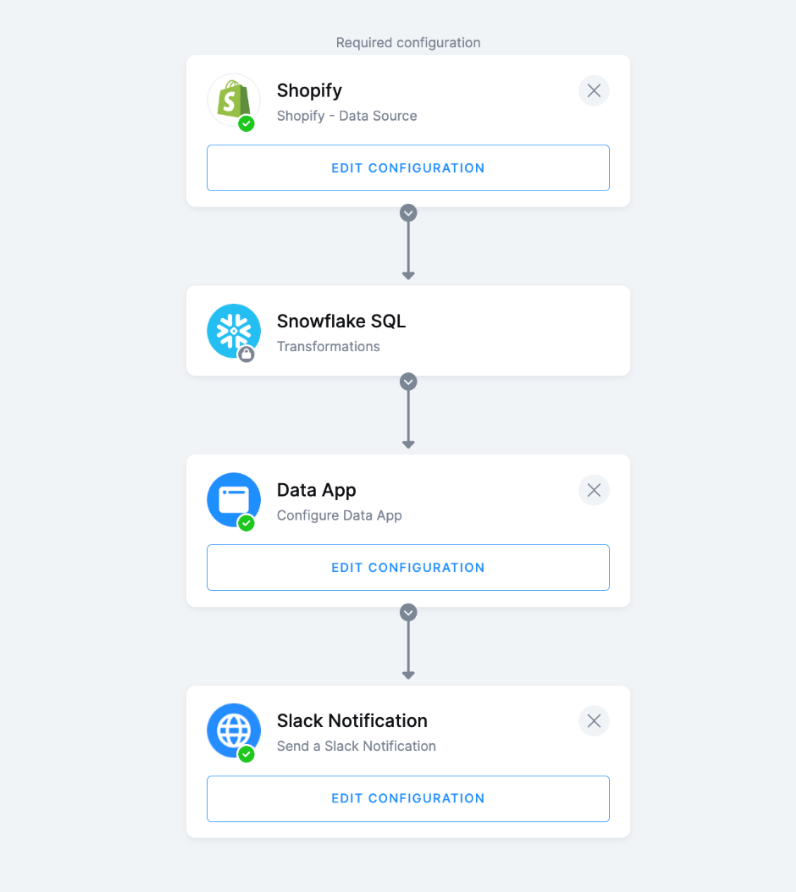
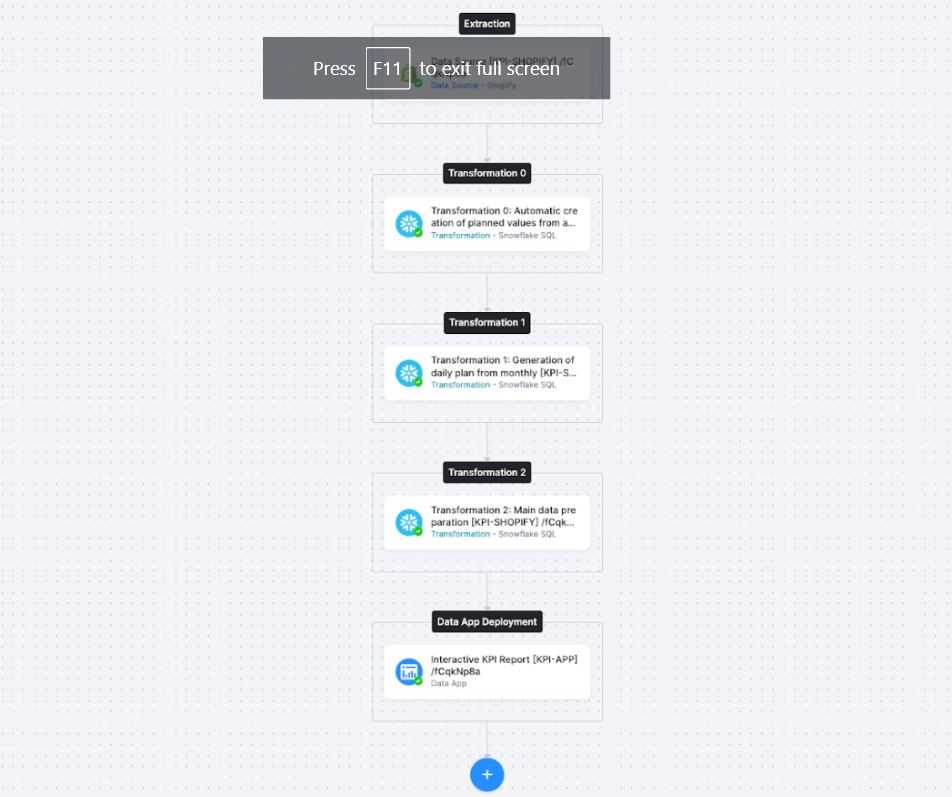
The first flow is for building interactive dashboards based on transformed data extracted from Shopify:
- First, you will authorize the data source connector to extract data from your Shopify account.
- An SQL transformation will then prepare the data and create a table needed for the data app.
- The data will then be sent into the data app, where users can view and filter it by date.
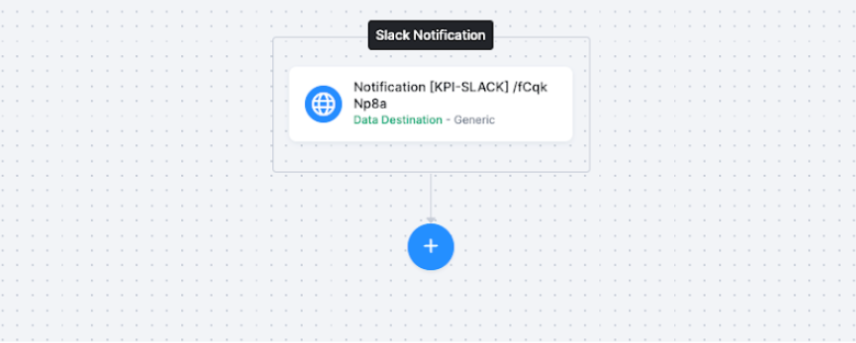
Sending Data into Slack
The second flow is triggered once the user wants to send any of the data from the interactive dashboard into Slack. Then it takes over.
You will authorize the data destination connector, which will send outputs to Slack when users decide to share data from the dashboards.
Entity Relationship Diagram
An entity-relationship diagram is a specialized graphic that illustrates the relationships between entities in a data destination.
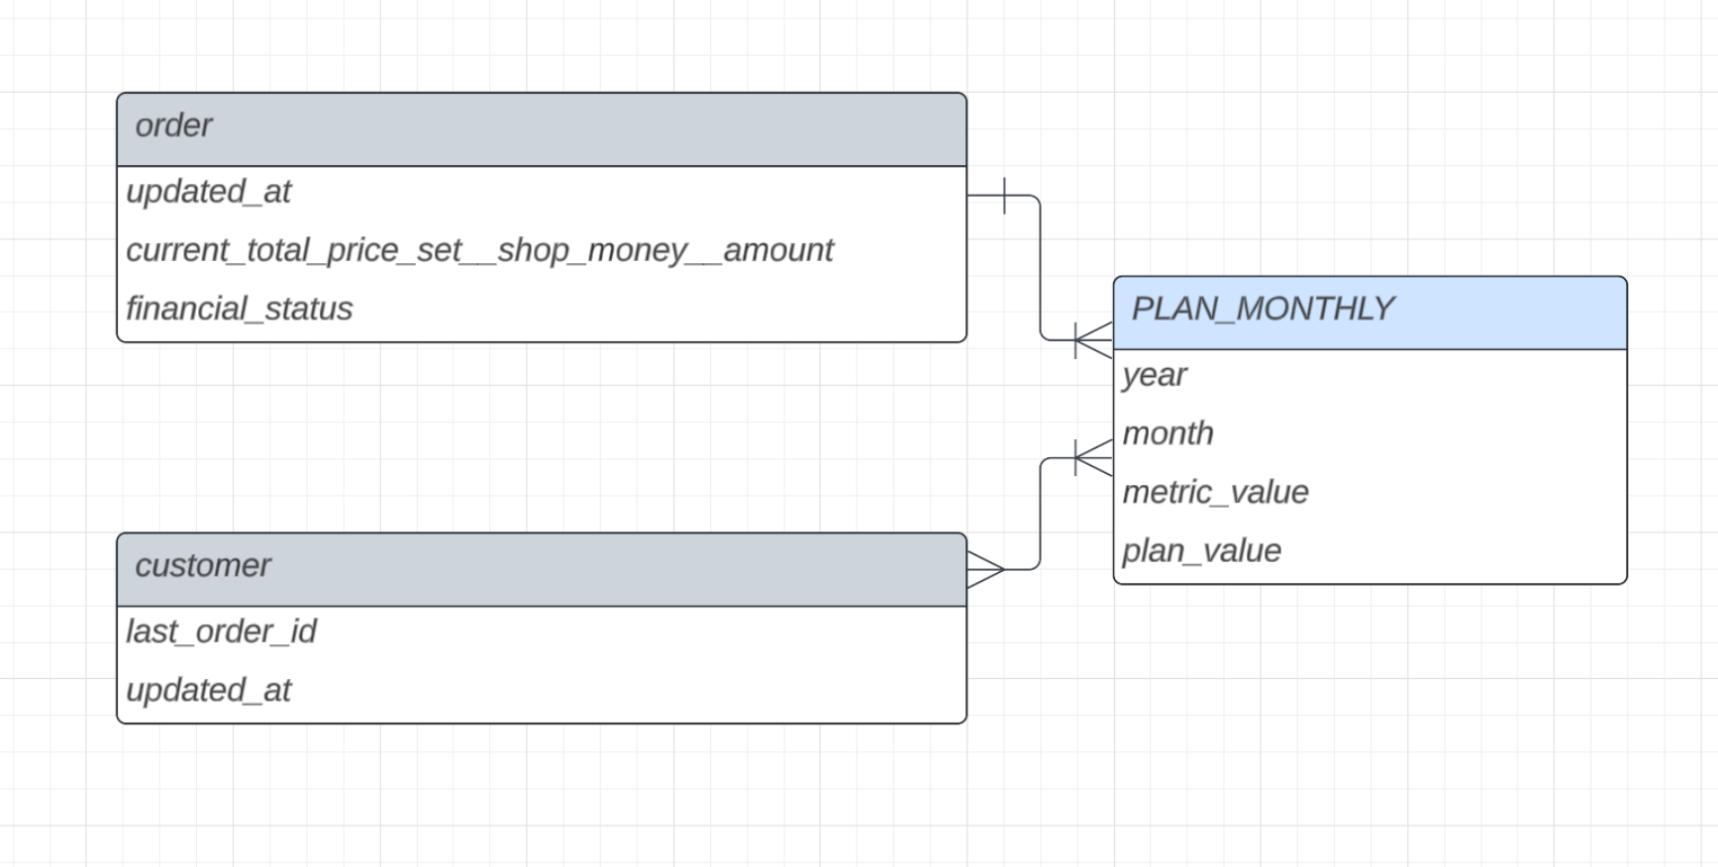
Table Description
| Name | Description |
|---|---|
| ORDER | contains data about orders, such as the last update, current price of the order, and a financial status of the given order (paid/refunded, etc.) |
| CUSTOMER | contains the ID of the last order (last_order_id) and a date stamp of the last update (updated_at) |
Data Sources
This data source is available:
Data Destinations
The following data destination is available:
How to Use Template
The process is simple. We will guide you through it, and, when needed, ask you to provide your credentials and authorize the data source and destination connectors.
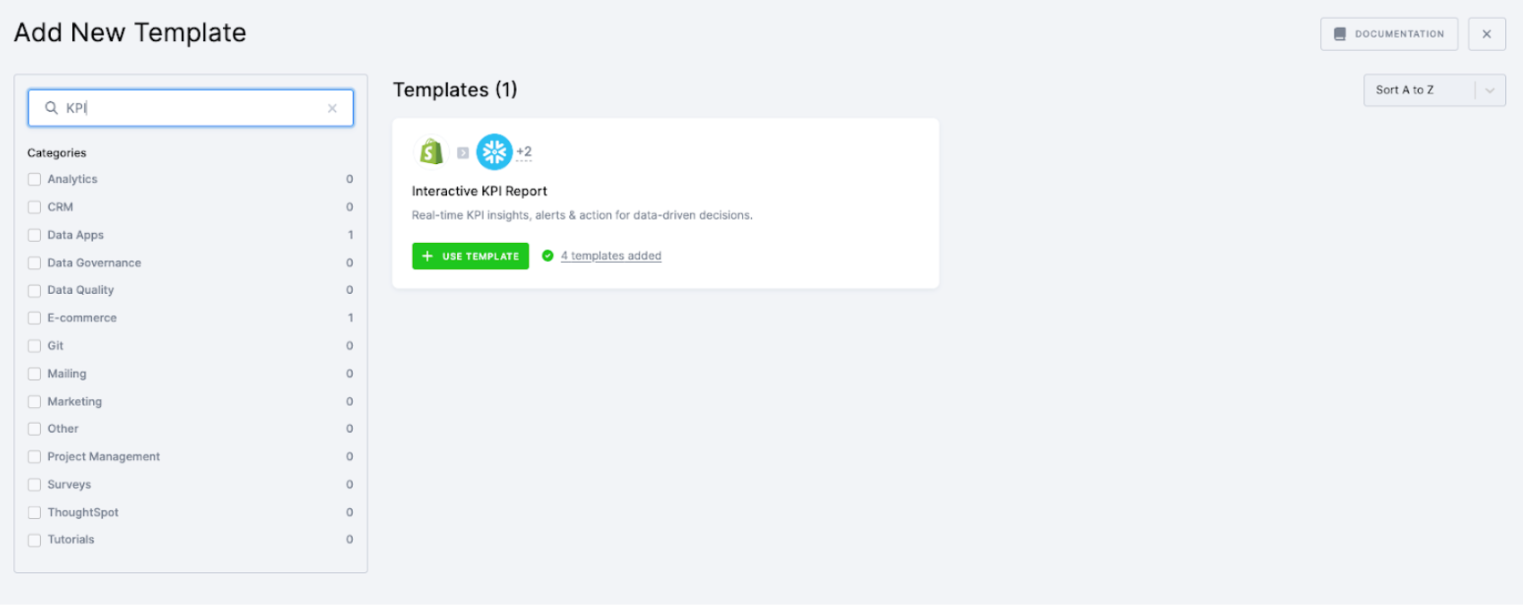
First decide which data source and which data destination you want to use. Then select the corresponding template from the Templates tab in your Keboola project. When you are done, click + Use Template.
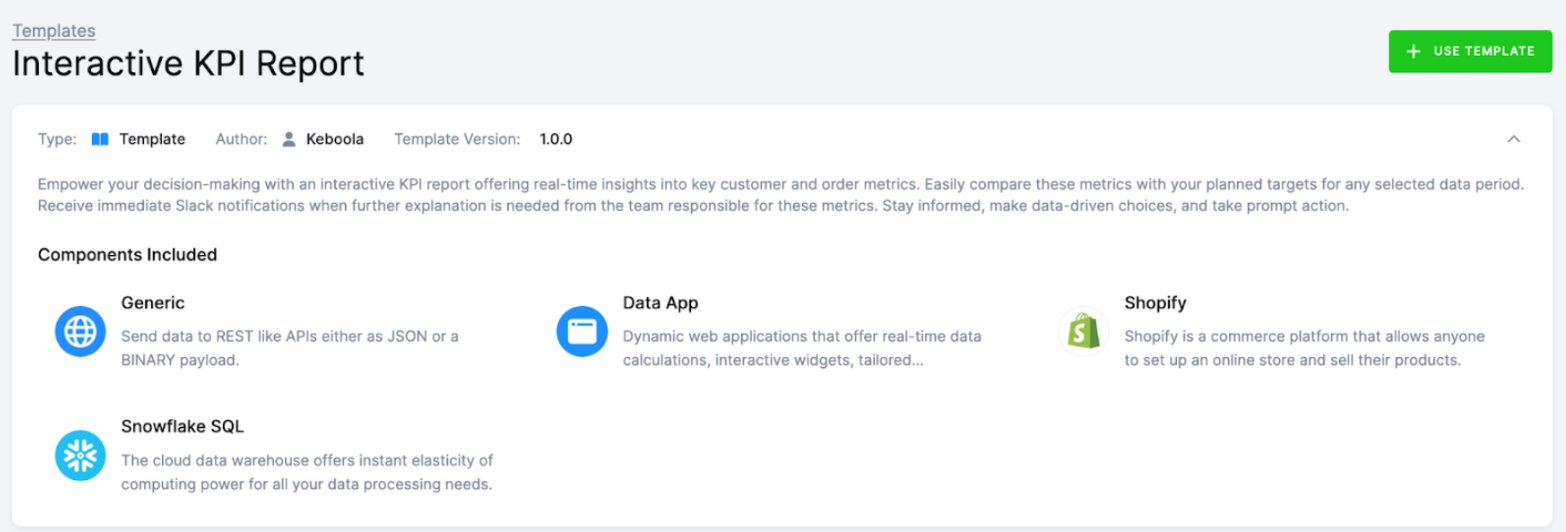
This page contains information about the template. Click + Use Template again.
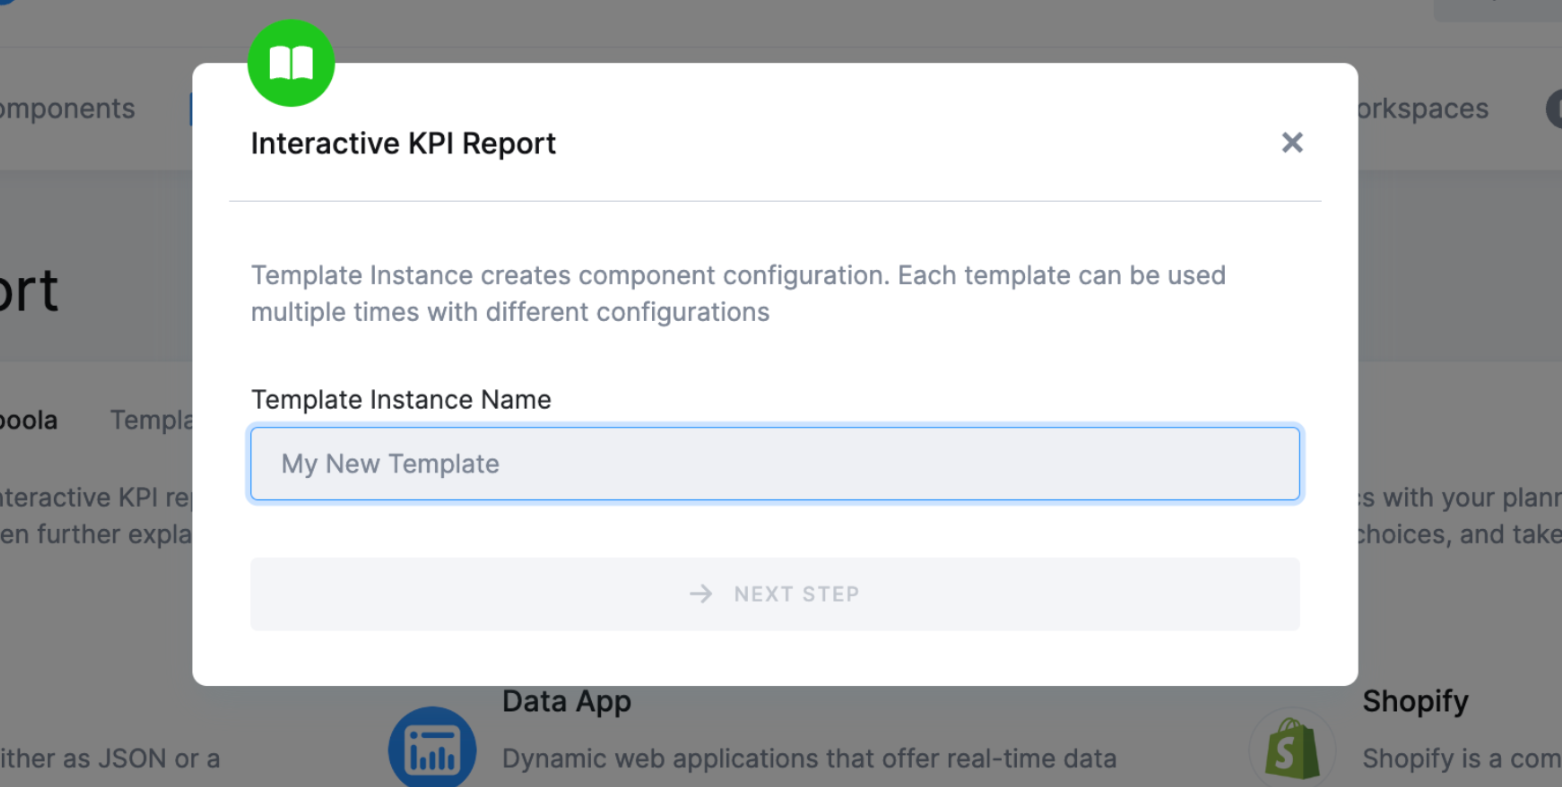
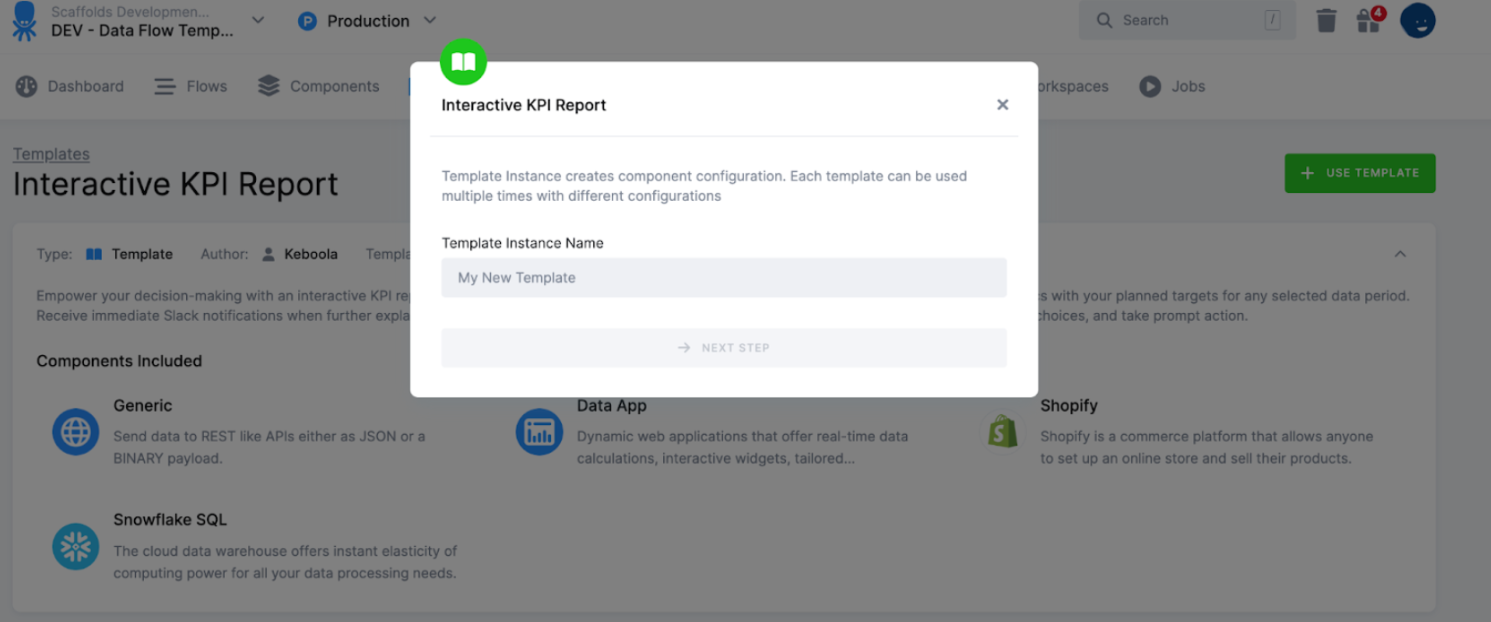
You’ll be asked to write a name for the template instance you are about to create. You can use the template as many times as you want and still keep everything organized.
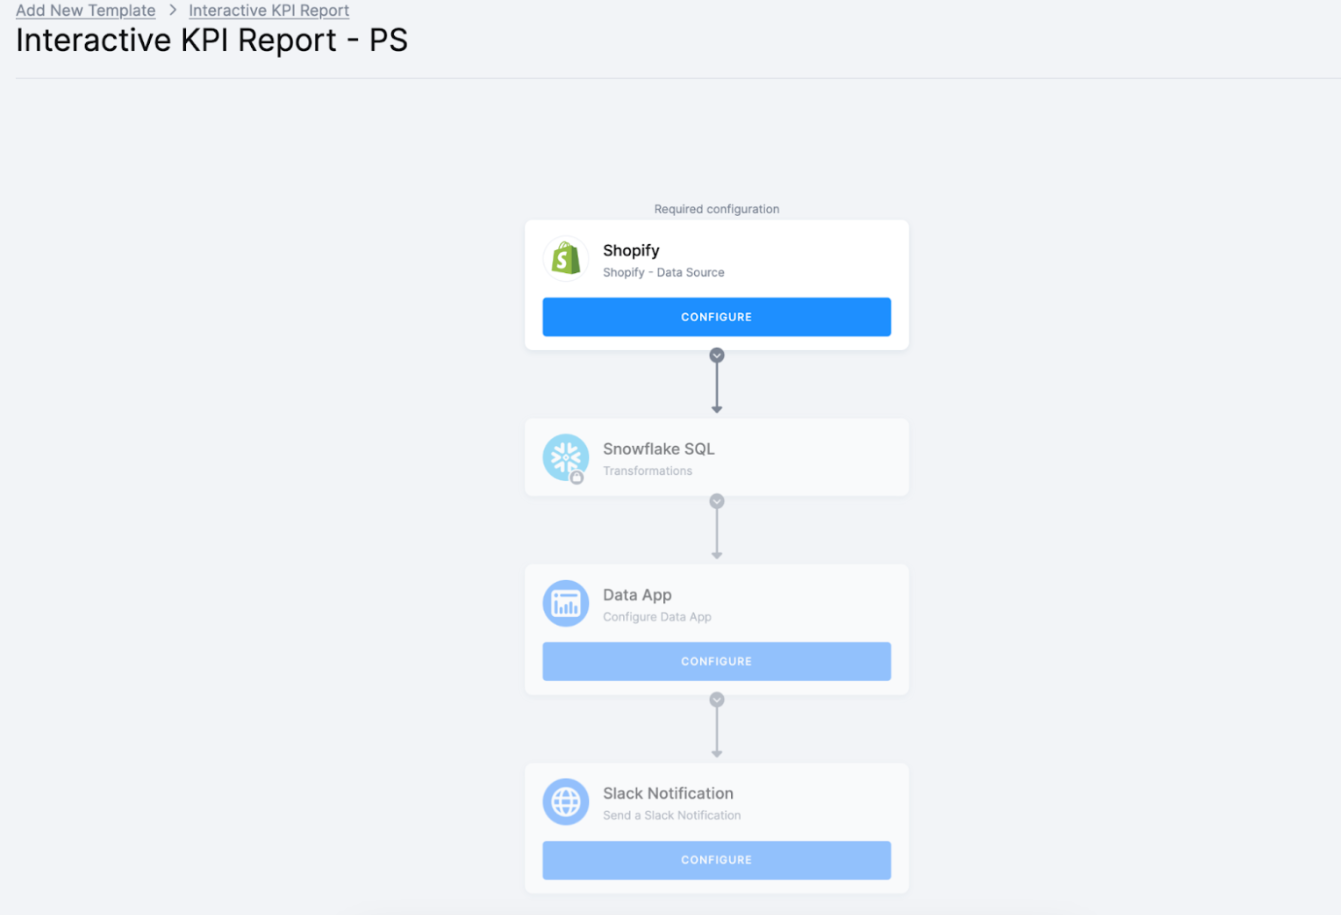
After clicking Next Step, you will see the template builder. Fill in all needed credentials and perform the required OAuth authorizations.
Important: Make sure to follow all the steps very carefully to prevent the newly created flow from failing because of any user authorization problems. If you are struggling with this part, go to the section Authorizing Data Destinations below.
When you are finished, click Save in the top right corner. The template builder will create your new configuration, and when it is done, you will see the newly created flow. Click Run Template and start building your visualizations a few minutes later.
How to Use Data App
To fully utilize this template, set up the pre-defined data app for data visualization.
To get started, follow these steps:
- Select this template from the list.
- Click Use Template. This will direct you to a page with detailed information about the template.
- Click Use Template once more, assign it a name, and proceed to the Next Step.
This will take you to the page where you can configure the data app template. Here, you will need to provide credentials for the data sources and data destinations you intend to use. Once you have completed this step, you can launch your data app using this template.
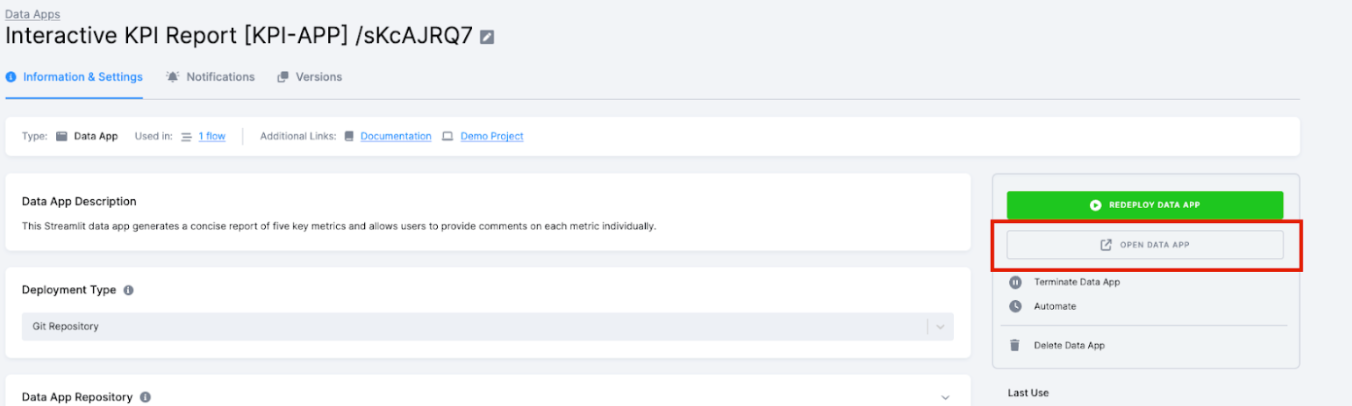
A data app has been created. You can find its details in the Components – Data Apps section, where you can edit the apps you have created.
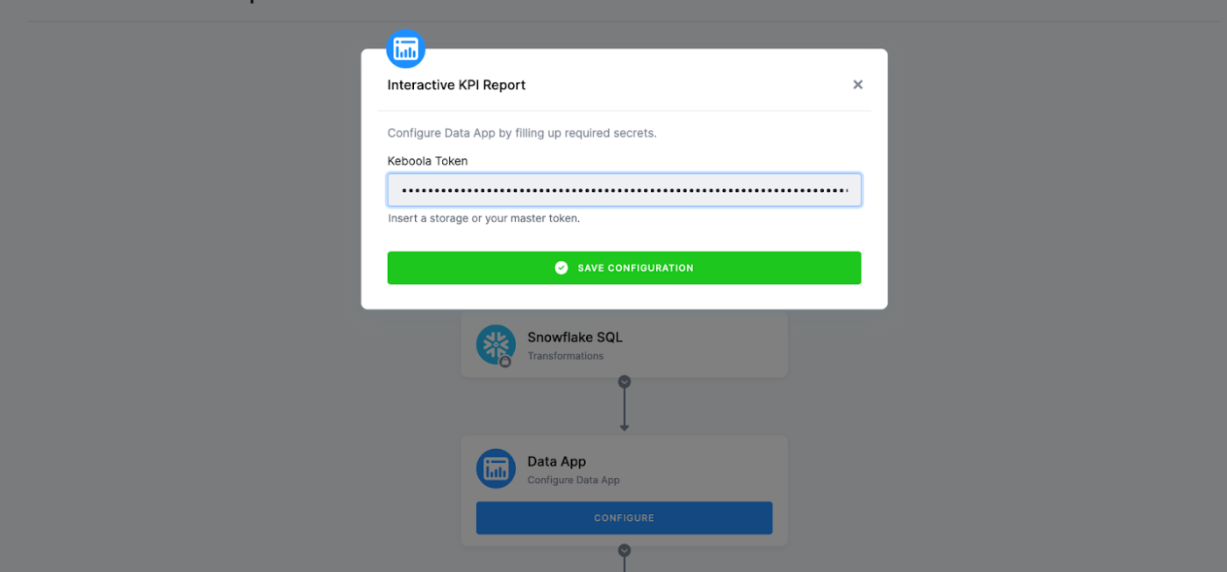
Below, you can see a screenshot of the data app created using the eCommerce KPI Dashboard template. When configuring the app for the eCommerce KPI Dashboard, simply insert the Keboola Token in the dialog box shown in the screenshot below and save the configuration.
Now, you are ready to go. The template is operational, and the interactive dashboards are prepared for users. The URL of the data app is located in the Components > Data Apps section, where you can search for the app by the name you assigned to it.
Upon opening the data app, you will find the link to its user interface on the right side of the screen.
Authorizing Data Sources
To use a selected data source connector, you must first authorize the data source.
Shopify
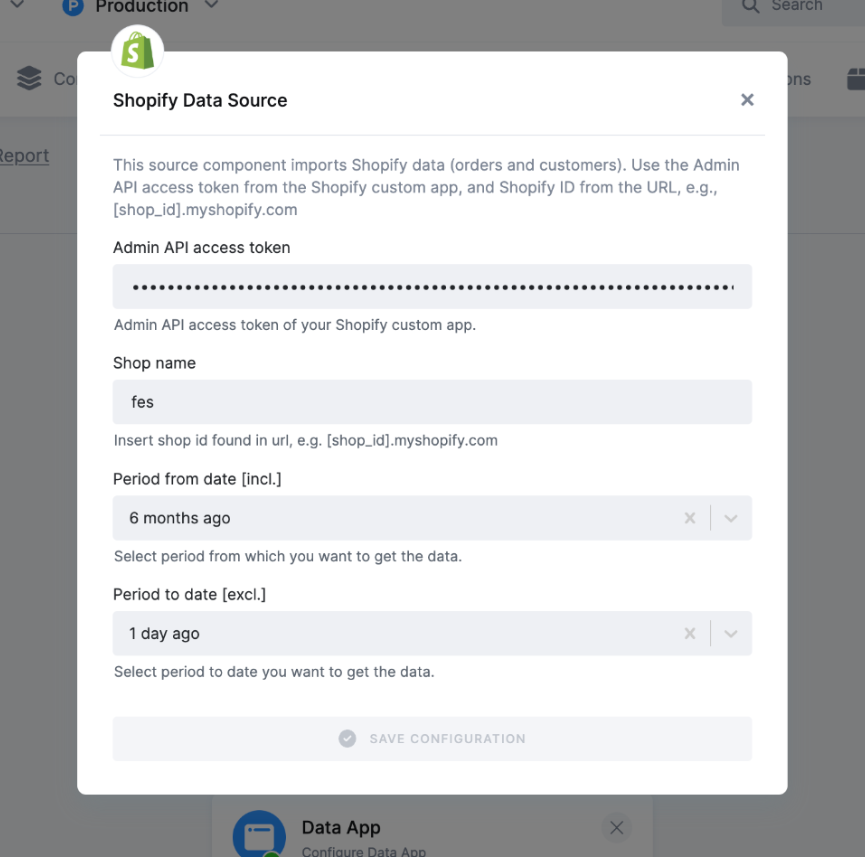
You will be asked to provide a few details from your Shopify account to authorize the connection between Keboola and Shopify.
First, you will need the Admin API access token, which you can easily generate using Shopify’s documentation. The shop name can be found in the Account Settings after signing in to your Shopify account.
Additionally, you have the option to customize the date range you wish to extract into Keboola. For more information on setting up your Shopify account, please refer to the component documentation.
Authorizing Data Destinations
Make sure to authorize the data destination.
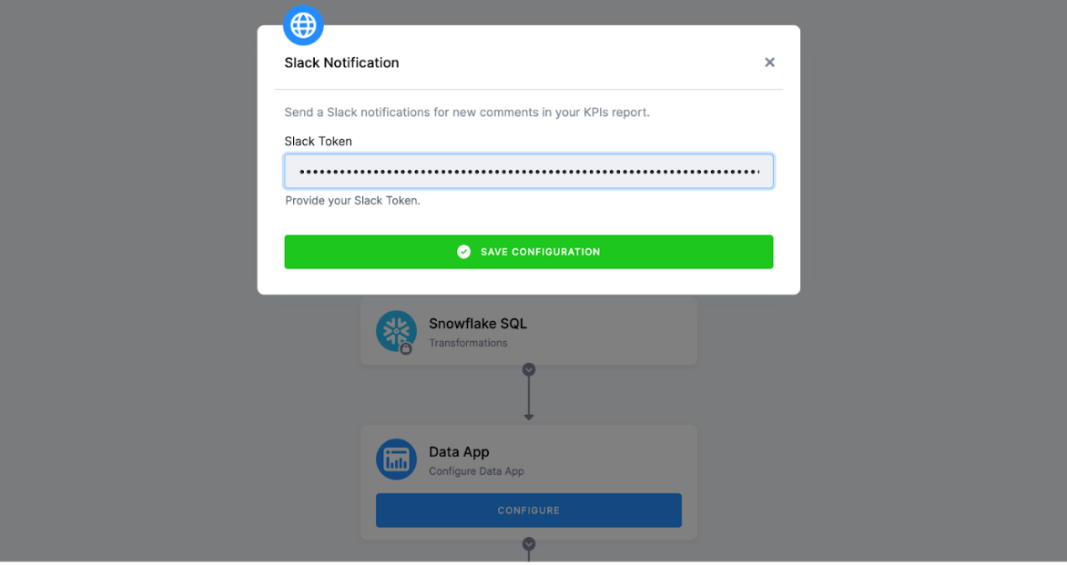
Slack
In order to set up the connector to Slack, you will only need to insert your Slack Token and click Save Configuration.